


This page provides the Year 0-8 part of the Mathematics and statistics learning area of the New Zealand Curriculum, the official document that sets the direction for teaching, learning, and assessment in all English medium state and state-integrated schools in New Zealand. In mathematics and statistics, students explore relationships in quantities, space, and data and learn to express these relationships in ways that help them to make sense of the world around them. It comes into effect on 1 January 2025.
The Year 9 to 13 content is provided in the Mathematics and Statistics Learning area.
You can download the Mathematics and Statistics Year 0-8 curriculum in PDF format below. There are different versions available for printing (spreads) and viewing online (single page).
File Downloads
No files available for download.
Links to mathematics and statistics supports and resources:


The following material on the New Zealand Curriculum, whakapapa of Te Mātaiaho and overview of the learning areas provides context when using the Mathematics and statistics Year 0-8 Learning Area. It is not part of the statement of official policy.
Te Mātaiaho | The New Zealand Curriculum Mathematics and statistics – Years 0‑8 (statement of official government policy) |
Ānō me he whare pūngāwerewere. This whakataukī celebrates intricacy, complexity, interconnectedness, and strength. The learning area of mathematics and statistics weaves together the effort and creativity of many cultures that over time have used mathematical and statistical ideas to understand their world. |
Board requirements
Mathematics and Statistics Years 0–8 is published by the Minister of Education under section 90(1) of the Education and Training Act 2020 (the Act) as a foundation curriculum policy statement and a national curriculum statement. These are the statements of official policy in relation to the teaching of mathematics and statistics that give direction to each school’s curriculum and assessment responsibilities (section 127 of the Act), teaching and learning programmes (section 164 of the Act), and monitoring and reporting of student performance (section 165 of the Act and associated Regulations). School boards must ensure that they and their principal and staff give effect to these statements. The sections of Mathematics and Statistics Years 0–8 that are published as a national curriculum statement are the Understand–Know–Do (UKD) progress outcomes for each phase (UKD for phase 1, UKD for phase 2, and UKD for phase 3). These set out what students are expected to learn over their time at school, including the desirable levels of knowledge, understanding, and skill to be achieved in mathematics and statistics. The rest is published as a foundation curriculum policy statement. This sets out expectations for teaching, learning, and assessment that underpin the national curriculum statement and give direction for effective mathematics and statistics (or maths, including numeracy) teaching and learning programmes. The statements come into effect on 1 January 2025. They replace curriculum levels 1–4 of the existing mathematics and statistics national curriculum statement (learning area). The remainder of the existing mathematics and statistics national curriculum statement remains in force. Apart from those for English Years 0–6, other existing foundation curriculum policy statements and national curriculum statements for the New Zealand Curriculum remain in place. Schools should choose the appropriate mathematics and statistics statements for their students’ needs. This means that intermediate and secondary schools may choose to make use of the new statements for some students if they are currently working below curriculum level 5, or that primary and intermediate schools may choose to make use of the existing statements for some students if they are already working above phase 3. Reading, writing, and maths teaching time requirements The teaching and learning of reading, writing,1 and maths2 is a priority for all schools. So that all students are getting sufficient teaching and learning time for reading, writing, and maths, each school board with students in years 0–8 must, through its principal and staff, structure their teaching and learning programmes and/or timetables to provide:
Where reading, writing, and/or maths teaching and learning time is occurring within the context of national curriculum statements other than English or mathematics and statistics, the progression of students’ reading, writing, and/or maths dispositions, knowledge, and skills at the appropriate level must be explicitly and intentionally planned for and attended to. |
Purpose Statement
In the mathematics and statistics learning area, students learn about and appreciate the power of symbolic representation, reasoning, and abstraction. They learn to investigate, interpret, and explain patterns and relationships in quantity, space, time, data, and uncertainty. As they achieve deep conceptual understanding and procedural fluency in the learning area, students can accurately and efficiently use mathematics and statistics as a foundation for new learning and to solve problems.
Students engage with mathematics and statistics through the exploration of problems, patterns, and trends and appreciate the everyday value of this learning in many areas of their lives, such as personal finance, health, dance, and design. Every student in New Zealand can engage in mathematics and statistics and discover personal enjoyment and curiosity in their learning.
Throughout their learning, students engage with diverse perspectives as they apply their mathematical and statistical understandings. They also learn that mathematics and statistics has an evolving history; many cultures have contributed to, and continue to contribute to, innovations that shape our current thinking.
As they move through the phases of the learning area, students come to understand the value of mathematical and statistical investigation as a lens for collective local, national, and global challenges. Mathematics and statistics allow us to engage with important societal matters, such as the robust and ethical gathering, interpretation, and communication of data, and the use of valid and reliable data to challenge misinformation and disinformation.
Learning in mathematics and statistics builds literacy by developing students’ skills in oral and written communication, reasoning, and comprehension. The learning area opens pathways into a wide range of industries that rely on mathematical and statistical knowledge and reasoning. Learning how to use this knowledge purposefully and flexibly allows students to participate fully in an increasingly technology- and information-rich world of work.
Understand-Know-Do Overview
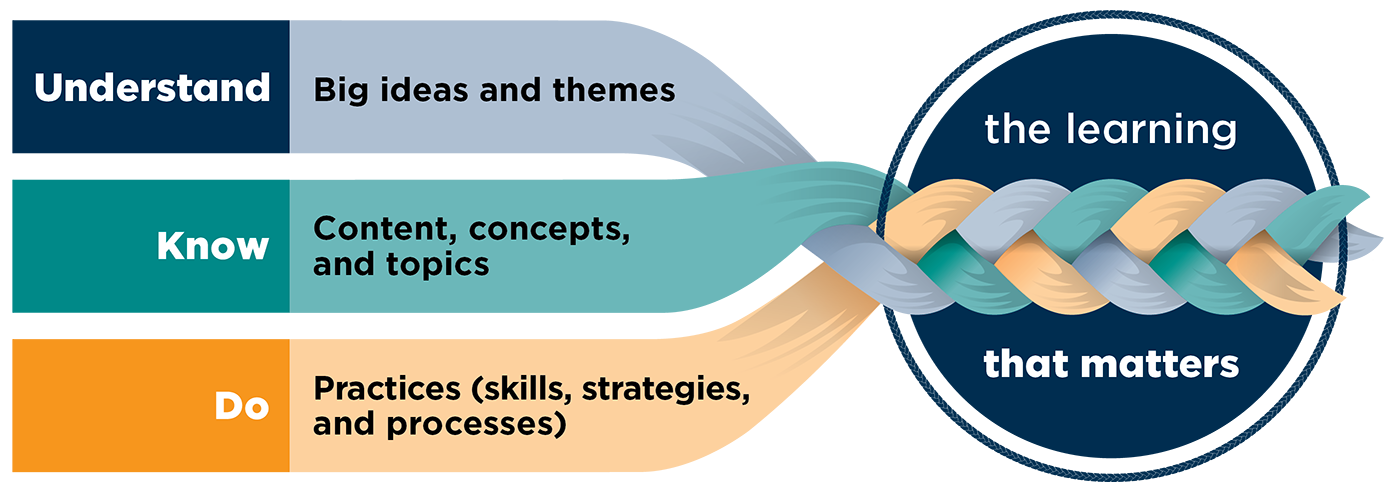
Phases 1, 2, and 3: Mathematics and statistics learning area structure
This section describes the structure of the mathematics and statistics learning area and how it changes over the five phases of learning. (See the Content of the learning areas section for the general structure of each learning area in the New Zealand curriculum.) Each phase has:
- a progress outcome describing what students understand, know, and can do by the end of the phase
- an introduction to the teaching sequence highlighting how to teach during this particular phase
- a year-by-year teaching sequence highlighting what to teach in the phase, along with teaching considerations for particular aspects of content.
Phases 1, 2, and 3: Teaching guidance
Key characteristics of how people learn have informed the development of the mathematics and statistics learning area. These characteristics are:
- We learn best when we experience a sense of belonging in the learning environment and feel valued and supported.
- A new idea or concept is always interpreted through, and learned in association with, existing knowledge.
- Establishing knowledge in a well-organised way in long-term memory reduces students’ cognitive load when building on that knowledge. It also enables them to apply and transfer the knowledge.
- Our social and emotional wellbeing directly impacts on our ability to learn new knowledge.
- Motivation is critical for wellbeing and engagement in learning.3
All five characteristics are interconnected in a dynamic way. They are always only pieces of the whole, so it is critical to consider them all together. The dynamic and individual nature of learning explains why we see individual learners develop along different paths and at different rates.
The implications of these characteristics for teaching mathematics and statistics are described in this section, with more detail in the introduction to each phase and the ‘teaching considerations’ in the year-by-year teaching sequences.
The remainder of this section focuses on three key areas of teacher decision making:
- developing a comprehensive teaching and learning programme
- using assessment to inform teaching
- planning.
Developing a comprehensive teaching and learning programme
A comprehensive mathematics and statistics programme needs the following components:
- explicit teaching
- positive relationships with mathematics and statistics
- rich tasks
- communication in mathematics and statistics.
Planning
This section provides guidance on what to pay attention to when planning mathematics and statistics teaching and learning programmes. In every classroom, there are many ways in which students engage in learning and show what they know and can do. Using assessment information and designing inclusive experiences, teachers plan an ‘entry point’ to a new concept or procedure that every student can access. Students’ interests and the school culture and community shape the planning, adding richness, creativity, and meaning to the programme.
Teaching and learning plans are developed for each year, topic or unit, week, and lesson and make optimal use of instructional time. The following considerations are critical when planning and designing learning:
- Develop plans using the teaching sequence statements for the year and knowledge of students’ prior learning. Plan for all students to experience all the statements in the sequence for their year level.
- Map out a year-long programme composed of ‘units’ by looking for opportunities where statements from the teaching sequence can be taught together. These may be in the same strand or across several strands (e.g., statistics and measurement; algebra and geometry). Plan to weave together learning under Know and Do across the unit to build understanding of the big ideas.
- Order the units so that new learning builds on students’ previous learning and connects over the course of the year. Consider the length of time allocated to specific strands and concepts across the year – some concepts may require more teaching time than others. Ensure the year’s programme includes opportunities to retrieve, consolidate, and extend learning around previously taught concepts and processes. Regular opportunities to revisit learning within and across units and years supports students to develop procedural fluency with mathematics and statistics concepts. The shape of these opportunities will vary, depending on students’ learning needs.
- Within unit or weekly plans, break down new concepts and procedures into a series of manageable learning experiences, so that students have several opportunities to develop understanding and fluency. Teach mathematics and statistics for an hour a day. Plan for a balance of explicit teaching (to introduce and reinforce learning) and rich tasks (to investigate a concept, support consolidation of previously taught concepts or procedures, and apply learning to new situations).
- Plan for inclusive teaching and learning at all times. Consider offering multiple methods of participating to all students so that they can engage in a variety of learning experiences and have multiple ways to show their progress. Design for equitable access in all learning opportunities. Identify and reduce barriers to learning, and plan universal supports that are available to all students.
- Use flexible groups within a lesson, based on the learning purpose for the lesson (e.g., working as a whole class for demonstration and discussion, in smaller groups to investigate a situation or solve a problem, in pairs to explain thinking and findings). Provide opportunities for both individual and collaborative work, and enable students to determine when they need to work with others and when they need time and space to work independently.
- Teach students to use digital tools accurately, appropriately, and efficiently to support their purpose. Enhance teaching and learning with tools for calculating, representing graphs and shapes, and analysing data. While using digital technology is an important skill, students still need the ability to estimate, visualise, and reason, so that they can evaluate whether findings generated by a digital tool are reasonable and effective.
To support students who have not developed the prior knowledge needed for teaching sequence statements for their year or have not learnt everything they have been explicitly taught, teachers can use accelerative approaches. These are approaches that make year-level concepts and procedures accessible to students. They can include additional, targeted small-group teaching, the use of verbal and visual prompts, carefully chosen representations, and explicit teaching of problem-solving strategies.
Teachers can extend students who have developed deep conceptual understanding and procedural fluency for their year by using more challenging rich tasks and problem solving that allow the students to apply their understanding to unfamiliar situations. This also encourages the students to develop further generalisations and to strengthen their mathematical and statistical communication and reasoning.
Dedicated mathematics and statistics lessons
Depending on the purpose of the lesson, plan to include one or more experiences in each part (Getting started, Working, and Connecting and reflecting). As students are working, take time to notice, recognise, and respond to their learning.
Getting started |
|
Working |
|
Connecting and reflecting |
|
Abstract |
Symbolic representation of a concept. |
Acceleration |
Acceleration or accelerated learning is where students are enabled to learn concepts and procedures more rapidly than the expected rate of progress. Accelerated learning approaches involve teaching students year-level content and experiences and supporting them with appropriate scaffolds to make this work accessible. |
Additive identity |
Zero will not change the value when added to a number. For example, 16 + 0 = 16. |
Algorithm |
A set of step-by-step instructions to complete a task or solve a problem. |
Algorithmic thinking |
Defining a sequence of clear steps to solve a problem. |
Argument |
Providing an idea or finding that is based on reasoning and evidence. |
Associative property |
A property of operations when three numbers can be calculated (addition or multiplication) in any order without changing the result. For example, (4 + 3) + 7 = 4 + (3 + 7) because 7 + 7 = 4 + 10, and (4 x 3) x 5 = 4 x (3 x 5). |
Assumptions |
A proposition (a statement or assertion) which is taken as being true with respect to a given context. |
Attribute |
A characteristic or feature of an object or common feature of a group of objects —such as size, shape, colour, number of sides. |
Base 10 |
Our number value system with ten digit symbols (0-9); the place value of a digit in a number depends on its position; as we move to the left, each column is worth ten times more, with zero used as a placeholder; to the right, the system continues past the ones’ column, to create decimals (tenths, hundredths, thousandths); the decimal point marks the column immediately to the right as the tenths column. |
Benchmarks |
A reference point that we can use for comparison or estimation. For example, “My finger is about one centimetre wide.” |
Categorical variables |
A variable that classifies objects or individuals into groups or categories. For example, hair colour, breed of dog. |
Chance |
The likelihood that an outcome will occur. |
Claim |
A statement of what the student believes to be correct. |
Commutative property |
In addition and multiplication, each number can be operated in any order. For example, 5 + 6 = 6 + 5. |
Compose and decompose |
Compose is to make a shape using other shapes. Decompose is to break a shape into other shapes. |
Comparison investigative question |
An investigative question that compares a variable across two clearly identified populations or groups. For example, “I wonder if girls in our class tend to be taller than boys in our class?” |
Conceptual understanding |
The comprehension of mathematical and statistical concepts, operations, and relations by connecting related ideas, representing concepts in different ways, identifying commonalities and differences between aspects of content, communicating their mathematical and statistical thinking, and interpreting mathematical and statistical information. |
Conjecture |
A statement whose truth or otherwise is not yet determined but is open to further investigation. |
Constant |
A constant term is a fixed value that will not change. |
Continuous materials |
Models based on relative length or area, such as a number line, fraction wall, bar model. |
Data |
A collection of facts, numbers, or information; the individual values of which are often the results of an experiment or observations. |
Data ethics |
The principles behind how data is gathered, protected, and used; at the core of ethical practice is the need to do good and to do no harm. |
Data visualisations |
A graphical, tabular, or pictorial representation of information or data. |
Deduction |
Make a conclusion based on knowledge, definitions, and rules. |
Digital tools |
Digital applications, calculators. |
Discrete materials |
Separate objects that can be counted and grouped. For example, counters, ice block sticks. |
Discrete numerical variables |
Variables that can be counted and have a limited range of possibilities. For example, number of students in each team, the result of rolling a die. |
Disinformation |
False information spread deliberately to deceive others. |
Distribution |
In mathematics, distribution describes spreading terms out equally across an expression; in statistics, distribution describes how data values are spread across the range of values collected. |
Distributive property |
An operation is said to be distributive over another operation if it can take priority over the operation used for combination within brackets. For example, 6 × 17 = 6 × (10 + 7) = (6 × 10) + (6 × 7) = 60 + 42 = 102. |
Efficient |
A procedure is said to be efficient when it is carried out in the most simple and effective way. |
Element in a pattern |
In a repeating pattern, an element is the repeating core. |
Equation |
A number statement that contains an equal sign. The expressions on either side of the equal sign have the same value (are equal). |
Equivalent fraction |
Two different fractions that represent the same number are referred to as equivalent fractions. For example, 1—2, 2—4, 3—6, and 4—8 are equivalent fractions because they represent the same number. |
Estimate |
A rough judgement of quantity, value, or number. In statistics, an assessment of the value of an existing, but unknown, quantity. In probability, the probability of an outcome in an experiment. |
Event |
One or more outcomes from a probability activity, situation, or experiment. |
Evidence |
Information, findings, data that support (prove) a statement or argument. |
Expression |
Two or more numbers, operations or variables connected by operations. Expressions do not include an equal or inequality sign. |
Families of facts |
A group of equations that use the same numbers. For example, 3 x 2 = 6, 2 x 3 = 6, 6 ÷3 = 2, 6 ÷ 2 = 3. |
Generalisation |
To recognise and describe patterns in relationships. |
Growing pattern |
A pattern where there is a constant increase or decrease between each term. For example, 5, 10, 15, 20. |
Horizontal method |
Representing the operation as an equation across the page, often partitioning one of the numbers into tens and units. For example, 16 + 23 = 16 + 20 + 3. |
Inequality |
A statement in which one number or expression is greater or less than another. |
Inference |
Making a conclusion based on evidence and reasoning. |
Informal unit |
A non-standard unit used to measure. For example, blocks, pens, fingers. The informal units used should all be the same size. |
Interpret |
To make meaning from something. |
Inverse operations |
The opposite operation, so addition is inverse to subtraction, and multiplication is inverse to division. They are useful to check calculations. For example, to check 4 x 5 = 20, we can see if 20 ÷5 = 4. |
Limitations |
Possible missing evidence or information. |
Mathematical modelling |
An investigation of the relationships and behaviours of quantities in physical, economic, social, and everyday contexts; used to analyse applied situations and make informed decisions, starting the model with forming assumptions. |
Misconception |
A misunderstanding about a procedure, method or definition in mathematics or statistics. This could be about which procedure is needed, how the procedure or method should be followed or an incorrect definition. For example, thinking that 2.5 is the decimal form of 2/5. |
Misinformation |
Incorrect information (mistakes). |
Multiplicative identity |
When a number is multiplied by 1, it does not change its value. For example, 15 x 1 = 15. |
Number sentence |
An equation or inequality expressed using numbers and mathematical symbols. For example, 10 + 10 = 3 + 7 + 5 + 5. |
One step transformation |
One change in a shape's position or size. For example, a triangle is flipped (reflected). |
Ordinal |
The numerical position of the element in the sequence. For example, first, second, third. |
Orientation |
The angle that an object is positioned. |
Outcomes |
A possible result of a trial of a probability activity or a situation involving an element of chance; could also refer to a result or a finding. |
Partition and regroup |
Partitioning is the process of "breaking up" numbers. For example, 55 = 50 + 5. |
Primary data |
Data collected first-hand for a specific purpose. For example, a survey, experiment, or interview. |
Probabilistic thinking |
Considering the likelihood (chance) of an outcome occurring; this is based on logic and reasoning. |
Probability experiment |
A test that can be carried out multiple times in the same way (trials). The outcome of each trial is recorded. |
Procedural fluency |
Choosing procedures appropriately and carrying them out flexibly, accurately, and efficiently. It is not the same as memorisation of facts and steps; rather it is being able to activate what you know and when to use it. |
Procedure |
A sequence of operations carried out in a specific order, such as the procedure to multiply two numbers, or the procedure to measure an object. |
Quantifying |
Expressing a quantity using numbers. |
Rational number |
All integers, fractions, and decimals. |
Reasoning |
Analysing a situation and thinking and working mathematically to arrive at a finding. |
Relational |
Symbols that show relationships between elements (terms) in an expression. For example, =, <, > |
Repeating pattern |
A pattern containing a 'unit of repeat'. For example, red, green, blue, red, green, blue. |
Secondary data |
Data collected by someone else, or a process, and/or obtained from another source. For example, online, books, other researchers. |
Subitise |
Instantly recognise the number of items in an arrangement without counting. |
Summary investigative question |
A question that asks about the overall distribution of the data or what is typical and reflects the population or group. For example, “I wonder how many pets are in our class? I wonder what the heights of the students in the class are?” |
Tangible and intangible |
Tangible is an object that can be touched. For example, a group of blocks. Intangible is a quality or measurement that cannot be touched. For example, colour or length. |
Term in a pattern |
One of the numbers in a pattern or sequence. For example, for 2, 4, 6, 8, the second term is 4. |
Theoretical probability |
A calculation of how likely an event is to occur in a situation involving chance. |
Uncertainty |
In probability, when the chance of an event occurring is unknown. |
Unit of repeat |
The part of a repeating pattern that repeats. The part is made up of several elements |
Variables (statistics and algebra) |
A property that may have different values for different individuals (statistics) or that may have different values at different times (statistics and algebra). |
Variation |
The differences seen in the values of a property for different individuals or at different times. |
Vertical column method |
The method for solving an operation by recording numbers in columns according to place value, working down the page. |
Visualisation |
To mentally represent and manipulate. |
References
1. While the terms reading and writing are used, these expectations are inclusive of alternative methods of communication, including New Zealand Sign Language, augmentative and alternative communication (AAC), and Braille.
2. For simplicity, ‘maths’ is used as an all-encompassing term to refer to the grouping of subject matter, dispositions, skills, competencies, and understandings that encompasses all aspects of numeracy, mathematics, and statistics.
3. A description of each characteristic is found here.