


This page provides the Year 0-8 part of the Mathematics and Statistics learning area of the New Zealand Curriculum, the official document that sets the direction for teaching, learning, and assessment in all English medium state and state-integrated schools in New Zealand. In mathematics and statistics, students explore relationships in quantities, space, and data and learn to express these relationships in ways that help them to make sense of the world around them. It comes into effect on 1 January 2025.
The Year 9 to 13 content is provided in the Mathematics and Statistics Learning area.
You can download the Mathematics and Statistics Year 0-8 curriculum in PDF format below. There are different versions available for printing (spreads) and viewing online (single page).
File Downloads
No files available for download.
Te Mātaiaho | The New Zealand Curriculum Mathematics and statistics: Phase 1 – Years 0‑3 |
Thriving in environments rich in literacy and maths |
Progress outcome by the end of year 3 (Foundation)
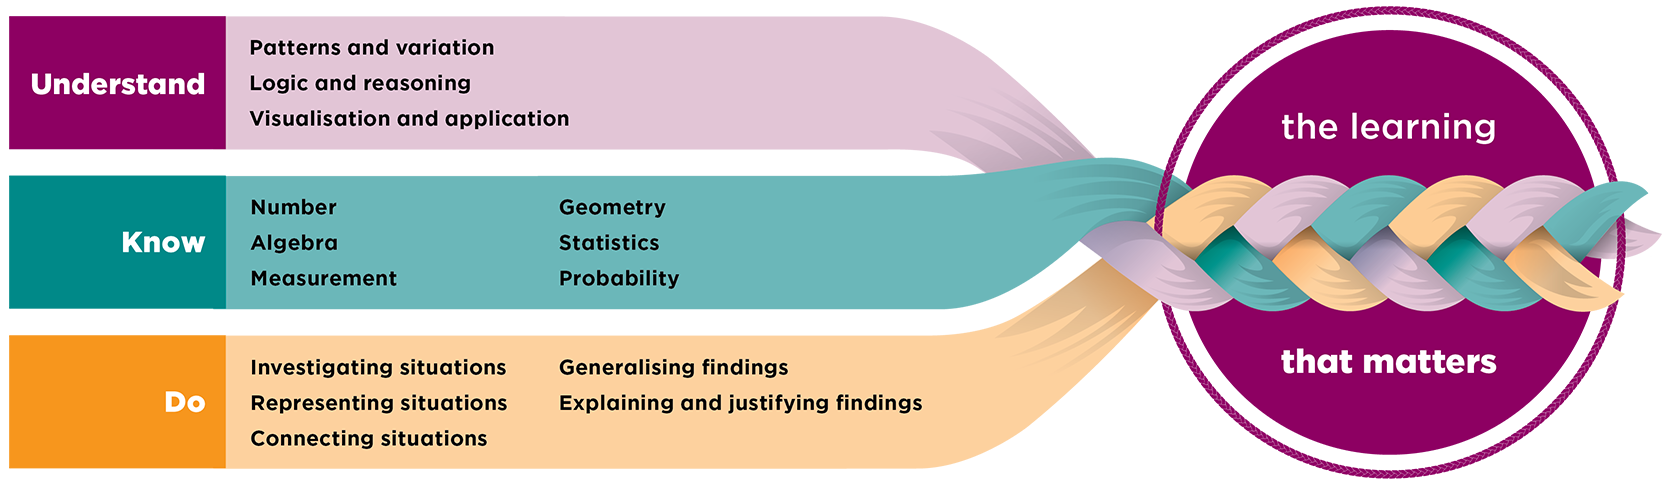
The critical focus of phase 1 is for all students to thrive in environments rich in literacy and maths. In mathematics and statistics, students learn to use logic and reasoning to investigate, classify, and describe patterns and variations in quantities, shapes, and data. They begin to generalise and to understand the properties of numbers and attributes of shapes. They use materials, number lines, and pictures to visualise these concepts, make connections between representations, and explain their reasoning.
The phase 1 progress outcome describes the understanding, knowledge, and processes that students have multiple opportunities to develop over the phase.
The phase 1 progress outcome is found in the table below.
Teaching sequence – Phase 1 (Years 0-3)
Thriving in environments rich in literacy and maths |
This section describes how the components of a comprehensive mathematics and statistics teaching and learning programme are used during the first phase of learning at school.
Throughout phase 1, students experience teaching that encourages curiosity and fosters success, as they explore environments and contexts rich in number and spatial elements. Active, hands-on experiences engage them in mathematics and statistics, with meaningful tasks that reflect their interests and the world outside the classroom.
Continuously monitor students’ reasoning, questions, engagement, and use of representations, and respond quickly to address any misconceptions. Be mindful of providing manageable learning experiences, building on students’ prior learning and leading to further challenge.
Number
During the first 6 months | During the first year | During the second year | During the third year | Teaching considerations | |
|---|---|---|---|---|---|
Number structure |
|
|
|
| Use a range of materials and images that represent structured and unstructured patterns and collections (e.g., dot patterns, 10s frames, dice, materials that can be grouped in 10 such as ice-block sticks). Also use language that quantifies and compares pattern arrangements (e.g. more, less, the same, different, combine, separate). Connect subitising to partitioning collections of objects (e.g., 6 and 2 on two dice are the same as 5 and 3 on two 10s frames). |
|
|
|
| Use a range of materials (e.g., number lines, 100s boards, number flip charts, 1,000s books, a Slavonic abacus, ice-block stick bundles). In general, support students to practise counting (e.g., in 2s and 5s) in short sequences (e.g., at year 3, “Count in 1s from 895 to 904; count in 2s from 90 to 110”). Investigate short patterns in multiples of 2s, 3s, 5s, and 10s, using rhymes, songs, choral counting, the grouping of discrete objects, the recording of patterns, and picture books. Have students practise finding 1, 10, or 100 more or less for a given number. Use materials to support students to identify numbers and patterns (e.g., 100s boards, 1,000s books). Connect to te reo Māori to support place-value (PV) understanding (e.g., tekau mā tahi (10 and 1), toru tekau mā rua (30 and 2). | |
|
|
|
| Have students practise saying, reading, and writing any given number within an identified number range. Use materials to support this (e.g., number flip boards, PV flip charts and houses). Explain that base 10 structure is based on groups of ten (ten ones form one ten, ten tens form one hundred, ten hundreds form one thousand etc.) and that both the position and value of a digit indicate the quantity it represents (e.g., 64 has 6 tens and 4 ones, 60 + 4 = 64). Have students investigate and represent the base 10 structure of numbers using a range of materials and digital tools (e.g., 100s boards, PV houses, PV blocks, ice-block sticks, arrow cards, number fans, words, numerals). Investigate odd and even numbers and the patterns they notice. Connect numerals, representations of them, and language (e.g., 652 represented with PV money: “652 = 600 + 50 + 2, 6 hundreds + 5 tens + 2 ones, six hundred and fifty two”). | |
|
|
|
| Show the sequencing of numbers using a number line (select-numbered, marked, or empty). Change the number-line orientation from horizontal to vertical if students need support with the concepts of before and after. Explain and use the language of comparison when demonstrating why one number is larger or smaller than another (e.g., “63 is larger than 36, as 6 tens is larger than 3 tens”). Show how the position of digits in the PV structure helps us to order and compare two- and three-digit numbers. | |
|
|
|
| Investigate and represent the partitioning of numbers using appropriate materials for the year level – for example:
Connect students’ subitising with pattern understanding (at 6 months and year 1) and known groupings and facts (at years 2–3). Explain and discuss how to systematically record the partitioning of numbers (e.g., using partitioning diagrams, tables, vertically-listed equations). | |
Operations |
|
|
| Explain and spend time developing the concepts of:
Have students investigate and connect practical estimation situations that involve quantities and measures (e.g., the number of balls in a box, the number of steps to the door, the length of a piece of string). | |
|
| ||||
|
|
|
| Explain and discuss addition and subtraction using representations, including:
Connect symbols and equations with problems, using correct vocabulary (e.g., ‘add’, ‘join’, and ‘plus’ for addition). Have students practise decoding and solving word problems. At year 3, explain and connect horizontal equations and the vertical-column method for addition and subtraction. Demonstrate making estimates or mental calculations by connecting to place value, partitioning, and known facts. Use a range of problem types (e.g., result, change, start-unknown). Use worked examples and think-alouds to explain the most efficient approaches when solving problems. Have students investigate and generalise adding 0 to or subtracting 0 from a number (at year 1) and applying the commutative property of addition (e.g., 5 + 4 = 4 + 5). | |
|
|
| Use materials to investigate addition and subtraction facts (e.g., counters, 10s frames, an abacus, multilink cubes), and use part-whole diagrams to develop subtraction facts and connect to addition facts. Explain how to record equations and families of facts, connecting with the language for each operation. Provide a range of tasks to consolidate learning and develop fluency (e.g., physical and digital games, using families of facts and, at year 3, table grids). | ||
|
| Use a range of materials to represent skip counting and multiplication and division facts (e.g., 100s boards, choral counting, games, number lines, a Slavonic abacus, families of facts, and, at year 3, table grids). Provide a range of tasks to consolidate learning and develop fluency. | |||
|
|
| Represent multiplication and division problems using discrete materials, pictures, diagrams, symbols, number lines, words, equations, digital tools, and, at year 3, arrays, PV materials, and bar models. Use correct mathematical language when discussing multiplication and division (e.g., multiply, groups of, sets of, rows of, equal groups, divide, share equally). Have students practise decoding and solving word problems. Connect with subitising and addition and subtraction concepts when demonstrating solving multiplication and division problems. Explain and represent division as a sharing problem (e.g., “Share 12 marbles equally among 3 friends”) or a grouping problem (e.g., “You have 12 marbles. How many groups of 3 marbles can you make?”). Use worked examples and think-alouds to explain the most efficient approaches when solving multiplication and division problems. Investigate and generalise multiplying a number by 0 or 1, dividing a number by 1, dividing a number by itself, and why we cannot divide by 0 (e.g., by trying to solve 0 × _ = 5). At year 3, explain and use the multiplicative identity (e.g., 5 × 1 = 5, 4 ÷ 1 = 4) and commutative property (e.g., 3 × 4 = 4 × 3). Demonstrate making estimates or mental calculations by connecting to place value, partitioning, and known facts. | ||
| |||||
Rational numbers |
|
|
| Represent fractions using a range of materials – continuous (bar models, number lines), discrete (sets of objects), and digital. Explain and reinforce that when fractions are represented symbolically:
Have students practise saying, reading, and writing fractions in words and symbols. Explain how to fold paper strips to create fractions of one whole. Label the parts using words and symbols, and use them to create a fraction wall for comparing and ordering fractions. Explain that a fraction is a number that can be placed on a number line. | |
|
| ||||
|
|
| Investigate a range of practical situations using a range of representations, including materials, drawings and diagrams, and digital tools (e.g., discrete objects, bar models, paper strips for partitioning). Make connections between:
Use mathematical language to develop an understanding of fractions (e.g., numerator, denominator, shared equally, divide, partition, equal parts). | ||
| Investigate adding and subtracting fractions within familiar contexts (e.g., cutting apples into eighths or partitioning paper strips into six equal parts, and then representing addition and subtraction with these materials). Connect representations, including symbols and equations, to drawings and materials (e.g., fraction walls, paper fraction strips), and show them on a number line. | ||||
Financial maths |
|
| Have students use play money (coins and notes) to represent practical financial situations. At year 2, compare only notes with notes or cents with cents, not a mixture of them. At year 2, investigate appropriate financial situations that involve both saving and spending. Connect to place value, addition and subtraction, and skip counting when calculating amounts. |
Algebra
During the first 6 months | During the first year | During the second year | During the third year | Teaching considerations | |
|---|---|---|---|---|---|
Equations and relationships |
|
|
| Represent the equal sign as the ‘same as’ to demonstrate it is a symbol of equivalence. Investigate number sentences using representations such as:
At years 2–3, solve number sentences that have numbers beyond what students are using in operations, so that the emphasis is on the equal relationship, not operating. | |
|
|
|
| Investigate repeating and growing patterns in a range of contexts (e.g., cultural patterns, patterns in the local environment and on everyday objects). Use materials, sound, movement, and digital tools to represent and continue repeating and growing patterns. At years 2–3, demonstrate recording the pattern in a table. Form generalisations when students notice that repeating patterns constructed in different ways are similar (e.g., ‘red, blue, red, blue’ and ‘hop, jump, hop, jump’ are ABAB patterns). Help students to notice the similarities and differences between patterns by recording them. With students at year 2, generalise by using the unit of repeat and ordinal position to identify further elements in a pattern. Use mathematical language and sentence starters to support students to explain and justify how a pattern is repeating or growing and to predict further terms. | |
Algorithmic thinking |
|
|
| Represent step-by-step instructions using drawings, words, flow diagrams, and verbal instructions that form a sequence. With students, investigate sorting unfamiliar and familiar objects according to a set of instructions, directing a person or object (e.g., through an obstacle course or maze), and following and creating a set of pictorial instructions. Explain, justify, and show how a set of instructions is complete or incomplete, using think-alouds and prompts. Connect a series of events from a story, narrative, or daily timetable with statements in Number, Algebra, Measurement, and Geometry. |
Measurement
During the first 6 months | During the first year | During the second year | During the third year | Teaching considerations | |
|---|---|---|---|---|---|
Measuring |
|
| Explain estimation, using the language of ‘about’, ‘more or less’, and ‘close to’ to help students reflect on what the quantity or measure might be. Investigate practical estimating and measuring situations, using appropriate measuring tools (e.g., at year 2, balance scales, capacity containers, informal units; at year 3, rulers, measuring jugs and cups, scales). At year 3, explain how to construct and use measurement devices, particularly rulers, measurement containers, and balance scales. Demonstrate how to accurately measure length in centimetres, mass (weight) in grams, and capacity in millilitres (at year 3). | ||
|
|
|
| Investigate practical measuring situations to compare and order objects – for example:
Use mathematical language to explain and justify comparative measurement attributes (e.g., long and short; heavy, heavier, and heaviest; the same as; full and empty; more and less; wide, wider, and widest). Include descriptive te reo Māori that makes the properties of objects and shapes clear. | |
|
| Investigate and explain situations involving angles as ‘how far an object or person has turned.’ Have students turn physical objects and themselves. Connect turns with fractions (e.g., half, a quarter, three quarters). | |||
|
|
|
| Use visual representations to support the sequencing of events (e.g., pictorial daily timetables, calendars, day-and-month cards). Explore estimating the duration of everyday events using minutes and seconds (e.g., “How long is it until the bell rings?”). Practise recalling a sequence of events in the past and predicting future events. Use mathematical language to explain and justify comparisons of duration and points in time (e.g., before, after, soon, later, next, today, tomorrow, yesterday, 1st, 2nd, 3rd). Investigate using a calendar to work out the number of days, weeks, or months until important events (e.g., the number of days until Matariki, the number of weeks until the end of term). Explore informal ways of measuring short periods of time to identify which events last longer. | |
|
|
| Use digital and analogue clocks to have students practise telling the time. Connect using visual representations on an analogue clock to skip counting in 5s and fractions (a half and quarter). Connect the ‘structure’ of duration (minutes, hours, days) to our measures of time (“There are 30 minutes in half an hour, 60 minutes in an hour”). Identify and investigate the specific times of daily events and activities in and out of school. | ||
Perimeter, area, and volume |
|
| Explain and demonstrate that:
Investigate familiar practical situations involving perimeter, area, and volume. Use think-alouds to demonstrate the use of visualising to identify the appropriate attribute for a measurement task and to imagine the number of units required. Explain the importance of using the same unit when measuring, and that there should be no gaps or overlaps around the outside (perimeter) and inside (area) of 2D shapes and in filled 3D shapes (volume). |
Geometry
During the first 6 months | During the first year | During the second year | During the third year | Teaching considerations | |
|---|---|---|---|---|---|
Shapes |
|
|
|
| Make available a range of 2D and 3D shapes, including tactile shapes and materials (e.g., playdough, pipe cleaners), pictures, diagrams, and digital tools. Investigate 2D and 3D shapes in the environment. Use everyday language and mathematical language (including te reo Māori) to explain and justify the describing and sorting of shapes (e.g., size, corners, colour, texture, sides, angles, faces, edges, vertices, triangle/tapatoru, square/tapawhā rite, same/ōrite, different/rerekē). Use generalisations made by students to clarify and extend understanding (e.g., “Polygons have straight sides”, “2D shapes can be identified on 3D shapes”). |
| |||||
Spatial reasoning |
|
|
|
| Make available a range of materials to compose and decompose 2D shapes (e.g., pattern blocks, attribute shapes, paper shapes, playdough, tangrams). Use think-alouds to demonstrate anticipating how small shapes can fit into or make a new shape. Use as target shapes:
|
|
|
| Connect the informal vocabulary of flip, slide, and turn with the formal vocabulary of reflect, translate, and rotate. Investigate practical situations (e.g., making art, paper folding, checking symmetry with mirrors) and a range of artefacts and patterns. | ||
Pathways |
|
|
|
| Investigate ways of moving to different locations within the classroom and in other parts of the school, using simple maps at year 3. Use picture books that emphasise positional language and movement (e.g., Scatter Cat, Bears in the Night, We’re Going on a Moa Hunt). Use spatial language and talk frames to support giving and following instructions (e.g., near, far, next to, beside, on top, under, over, down, up, left, right, turn). Make connections between:
|
|
|
|
Statistics
During the first 6 months | During the first year | During the second year | During the third year | Teaching considerations | |
|---|---|---|---|---|---|
Problem |
|
|
| Show, with student input, how to:
| |
Plan |
|
| Pose, with student input, survey and data-collection questions that will be used to collect the data required for the investigative question. Explain the distinction between primary and secondary data and the challenges that come with sensitive topics or questions. Investigate how survey questions and the words within survey questions can be interpreted differently by different people. | ||
Data |
|
|
| Represent data using data cards, recording sheets, and tally tables. Use data cards that represent multiple variables about an individual. Explore investigative questions using secondary data sources. | |
Analysis |
|
|
| Show creating and describing data visualisations, transitioning from data cards to dot plots to bar graphs. Represent data using data cards and picture graphs (for years 1–3), frequency tables and dot plots (for years 2–3), and bar graphs (for year 3). Have students practise using ‘I notice’ statements that include the variable name and context when describing data visualisations. Explain and demonstrate ‘reading the data’ and ‘reading between the data’. Explain how to describe features of data visualisations (e.g., frequency, the least/most frequent category, modes or modal groups, highest and lowest values). | |
Conclusion |
|
| Show, with student input, how to:
| ||
Statistical literacy |
|
|
| Show, with student input, how to:
| |
Probability
During the first 6 months | During the first year | During the second year | During the third year | Teaching considerations | |
|---|---|---|---|---|---|
Probability investigations |
|
| Investigate probability by playing games of chance using physical objects (e.g., dice, coins, spinners, pulling things out of a hat). Explain and show how to:
| ||
Critical thinking in probability |
|
| Show, with student input, how to:
| ||
The language of mathematics and statistics: Phase 1
At 6 months | Year 1 | Year 2 | Year 3 | |
|---|---|---|---|---|
Number |
|
|
|
|
Algebra |
|
|
|
|
Measurement |
|
|
|
|
Geometry |
|
|
|
|
Statistics |
|
|
| |
Probability |
|
|
|
Abstract |
Symbolic representation of a concept. |
Acceleration |
Acceleration or accelerated learning is where students are enabled to learn concepts and procedures more rapidly than the expected rate of progress. Accelerated learning approaches involve teaching students year-level content and experiences and supporting them with appropriate scaffolds to make this work accessible. |
Additive identity |
Zero will not change the value when added to a number. For example, 16 + 0 = 16. |
Algorithm |
A set of step-by-step instructions to complete a task or solve a problem. |
Algorithmic thinking |
Defining a sequence of clear steps to solve a problem. |
Argument |
Providing an idea or finding that is based on reasoning and evidence. |
Associative property |
A property of operations when three numbers can be calculated (addition or multiplication) in any order without changing the result. For example, (4 + 3) + 7 = 4 + (3 + 7) because 7 + 7 = 4 + 10, and (4 x 3) x 5 = 4 x (3 x 5). |
Assumptions |
A proposition (a statement or assertion) which is taken as being true with respect to a given context. |
Attribute |
A characteristic or feature of an object or common feature of a group of objects —such as size, shape, colour, number of sides. |
Base 10 |
Our number value system with ten digit symbols (0-9); the place value of a digit in a number depends on its position; as we move to the left, each column is worth ten times more, with zero used as a placeholder; to the right, the system continues past the ones’ column, to create decimals (tenths, hundredths, thousandths); the decimal point marks the column immediately to the right as the tenths column. |
Benchmarks |
A reference point that we can use for comparison or estimation. For example, “My finger is about one centimetre wide.” |
Categorical variables |
A variable that classifies objects or individuals into groups or categories. For example, hair colour, breed of dog. |
Chance |
The likelihood that an outcome will occur. |
Claim |
A statement of what the student believes to be correct. |
Commutative property |
In addition and multiplication, each number can be operated in any order. For example, 5 + 6 = 6 + 5. |
Compose and decompose |
Compose is to make a shape using other shapes. Decompose is to break a shape into other shapes. |
Comparison investigative question |
An investigative question that compares a variable across two clearly identified populations or groups. For example, “I wonder if girls in our class tend to be taller than boys in our class?” |
Conceptual understanding |
The comprehension of mathematical and statistical concepts, operations, and relations by connecting related ideas, representing concepts in different ways, identifying commonalities and differences between aspects of content, communicating their mathematical and statistical thinking, and interpreting mathematical and statistical information. |
Conjecture |
A statement whose truth or otherwise is not yet determined but is open to further investigation. |
Constant |
A constant term is a fixed value that will not change. |
Continuous materials |
Models based on relative length or area, such as a number line, fraction wall, bar model. |
Data |
A collection of facts, numbers, or information; the individual values of which are often the results of an experiment or observations. |
Data ethics |
The principles behind how data is gathered, protected, and used; at the core of ethical practice is the need to do good and to do no harm. |
Data visualisations |
A graphical, tabular, or pictorial representation of information or data. |
Deduction |
Make a conclusion based on knowledge, definitions, and rules. |
Digital tools |
Digital applications, calculators. |
Discrete materials |
Separate objects that can be counted and grouped. For example, counters, ice block sticks. |
Discrete numerical variables |
Variables that can be counted and have a limited range of possibilities. For example, number of students in each team, the result of rolling a die. |
Disinformation |
False information spread deliberately to deceive others. |
Distribution |
In mathematics, distribution describes spreading terms out equally across an expression; in statistics, distribution describes how data values are spread across the range of values collected. |
Distributive property |
An operation is said to be distributive over another operation if it can take priority over the operation used for combination within brackets. For example, 6 × 17 = 6 × (10 + 7) = (6 × 10) + (6 × 7) = 60 + 42 = 102. |
Efficient |
A procedure is said to be efficient when it is carried out in the most simple and effective way. |
Element in a pattern |
In a repeating pattern, an element is the repeating core. |
Equation |
A number statement that contains an equal sign. The expressions on either side of the equal sign have the same value (are equal). |
Equivalent fraction |
Two different fractions that represent the same number are referred to as equivalent fractions. For example, 1—2, 2—4, 3—6, and 4—8 are equivalent fractions because they represent the same number. |
Estimate |
A rough judgement of quantity, value, or number. In statistics, an assessment of the value of an existing, but unknown, quantity. In probability, the probability of an outcome in an experiment. |
Event |
One or more outcomes from a probability activity, situation, or experiment. |
Evidence |
Information, findings, data that support (prove) a statement or argument. |
Expression |
Two or more numbers, operations or variables connected by operations. Expressions do not include an equal or inequality sign. |
Families of facts |
A group of equations that use the same numbers. For example, 3 x 2 = 6, 2 x 3 = 6, 6 ÷3 = 2, 6 ÷ 2 = 3. |
Generalisation |
To recognise and describe patterns in relationships. |
Growing pattern |
A pattern where there is a constant increase or decrease between each term. For example, 5, 10, 15, 20. |
Horizontal method |
Representing the operation as an equation across the page, often partitioning one of the numbers into tens and units. For example, 16 + 23 = 16 + 20 + 3. |
Inequality |
A statement in which one number or expression is greater or less than another. |
Inference |
Making a conclusion based on evidence and reasoning. |
Informal unit |
A non-standard unit used to measure. For example, blocks, pens, fingers. The informal units used should all be the same size. |
Interpret |
To make meaning from something. |
Inverse operations |
The opposite operation, so addition is inverse to subtraction, and multiplication is inverse to division. They are useful to check calculations. For example, to check 4 x 5 = 20, we can see if 20 ÷5 = 4. |
Limitations |
Possible missing evidence or information. |
Mathematical modelling |
An investigation of the relationships and behaviours of quantities in physical, economic, social, and everyday contexts; used to analyse applied situations and make informed decisions, starting the model with forming assumptions. |
Misconception |
A misunderstanding about a procedure, method or definition in mathematics or statistics. This could be about which procedure is needed, how the procedure or method should be followed or an incorrect definition. For example, thinking that 2.5 is the decimal form of 2/5. |
Misinformation |
Incorrect information (mistakes). |
Multiplicative identity |
When a number is multiplied by 1, it does not change its value. For example, 15 x 1 = 15. |
Number sentence |
An equation or inequality expressed using numbers and mathematical symbols. For example, 10 + 10 = 3 + 7 + 5 + 5. |
One step transformation |
One change in a shape's position or size. For example, a triangle is flipped (reflected). |
Ordinal |
The numerical position of the element in the sequence. For example, first, second, third. |
Orientation |
The angle that an object is positioned. |
Outcomes |
A possible result of a trial of a probability activity or a situation involving an element of chance; could also refer to a result or a finding. |
Partition and regroup |
Partitioning is the process of "breaking up" numbers. For example, 55 = 50 + 5. |
Primary data |
Data collected first-hand for a specific purpose. For example, a survey, experiment, or interview. |
Probabilistic thinking |
Considering the likelihood (chance) of an outcome occurring; this is based on logic and reasoning. |
Probability experiment |
A test that can be carried out multiple times in the same way (trials). The outcome of each trial is recorded. |
Procedural fluency |
Choosing procedures appropriately and carrying them out flexibly, accurately, and efficiently. It is not the same as memorisation of facts and steps; rather it is being able to activate what you know and when to use it. |
Procedure |
A sequence of operations carried out in a specific order, such as the procedure to multiply two numbers, or the procedure to measure an object. |
Quantifying |
Expressing a quantity using numbers. |
Rational number |
All integers, fractions, and decimals. |
Reasoning |
Analysing a situation and thinking and working mathematically to arrive at a finding. |
Relational |
Symbols that show relationships between elements (terms) in an expression. For example, =, <, > |
Repeating pattern |
A pattern containing a 'unit of repeat'. For example, red, green, blue, red, green, blue. |
Secondary data |
Data collected by someone else, or a process, and/or obtained from another source. For example, online, books, other researchers. |
Subitise |
Instantly recognise the number of items in an arrangement without counting. |
Summary investigative question |
A question that asks about the overall distribution of the data or what is typical and reflects the population or group. For example, “I wonder how many pets are in our class? I wonder what the heights of the students in the class are?” |
Tangible and intangible |
Tangible is an object that can be touched. For example, a group of blocks. Intangible is a quality or measurement that cannot be touched. For example, colour or length. |
Term in a pattern |
One of the numbers in a pattern or sequence. For example, for 2, 4, 6, 8, the second term is 4. |
Theoretical probability |
A calculation of how likely an event is to occur in a situation involving chance. |
Uncertainty |
In probability, when the chance of an event occurring is unknown. |
Unit of repeat |
The part of a repeating pattern that repeats. The part is made up of several elements |
Variables (statistics and algebra) |
A property that may have different values for different individuals (statistics) or that may have different values at different times (statistics and algebra). |
Variation |
The differences seen in the values of a property for different individuals or at different times. |
Vertical column method |
The method for solving an operation by recording numbers in columns according to place value, working down the page. |
Visualisation |
To mentally represent and manipulate. |